SimplytheBest Charts Scripts
The simply the best collection of charts scripts
This jQuery plugin generates sparklines (small inline charts) directly in the browser using data supplied either inline or via JavaScript. The plugin is compatible with most modern browsers.
A JavaScript library for manipulating documents based on data. It helps you bring data to life using HTML, SVG and CSS. Combines powerful visualization components and a data-driven approach to DOM manipulation.
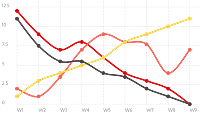
Simple yet flexible JavaScript charting for designers and developers. Visualize your data in 8 different ways, each of them animated and customisable.

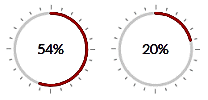
A lightweight jQuery plugin to render and animate nice pie charts with the HTML5 canvas element. Highly customizable, easy to implement, scale to the resolution of the display of the client to provide sharp charts even on retina displays and use requestAnimationFrame for smooth animations on modern devices.
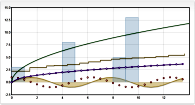
Fast interactive HTML5 charts with mobile and touch support. Includes its dependencies.
A jQuery plugin that converts an element's content into a SVG mini pie donut, line or bar chart and is compatible with any browser that supports SVG.


